Save
Download
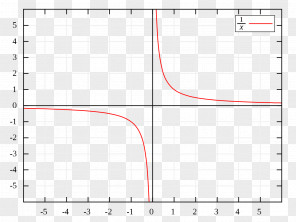
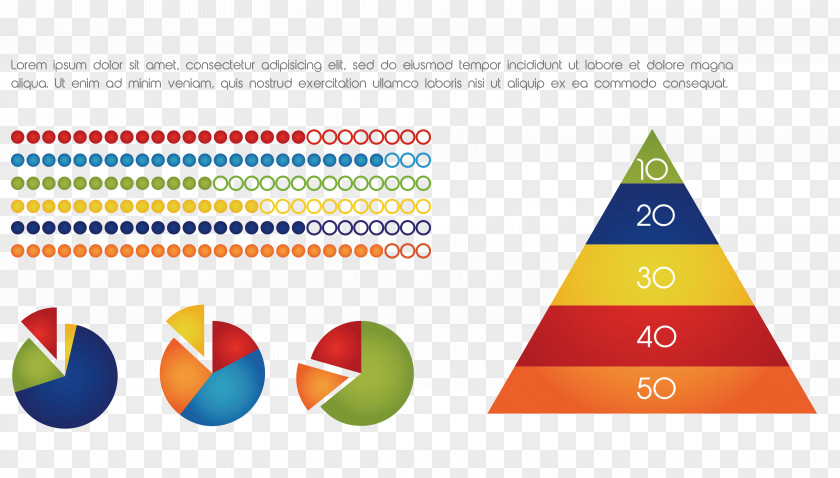
PPT Sector Proportion Vector Chart Graph Of A Function Curve
for free. It is licensed for Personal Use. ThePPT Sector Proportion Vector Chart Graph Of A Function Curve transparent background image
is 1.25 MB, has a resolution of 5892x3353 pixels and was uploaded on August 23, 2018 @ 12:25 pm by user: linaguer. It is filed under the tags: graph of a function, curve, cone, area, infographic. Click the blue button at the top to freely download: PPT Sector Proportion Vector Chart Graph Of A Function Curve png.PPT Sector Proportion Vector Chart Graph Of A Function Curve PNG
Users also downloaded these images